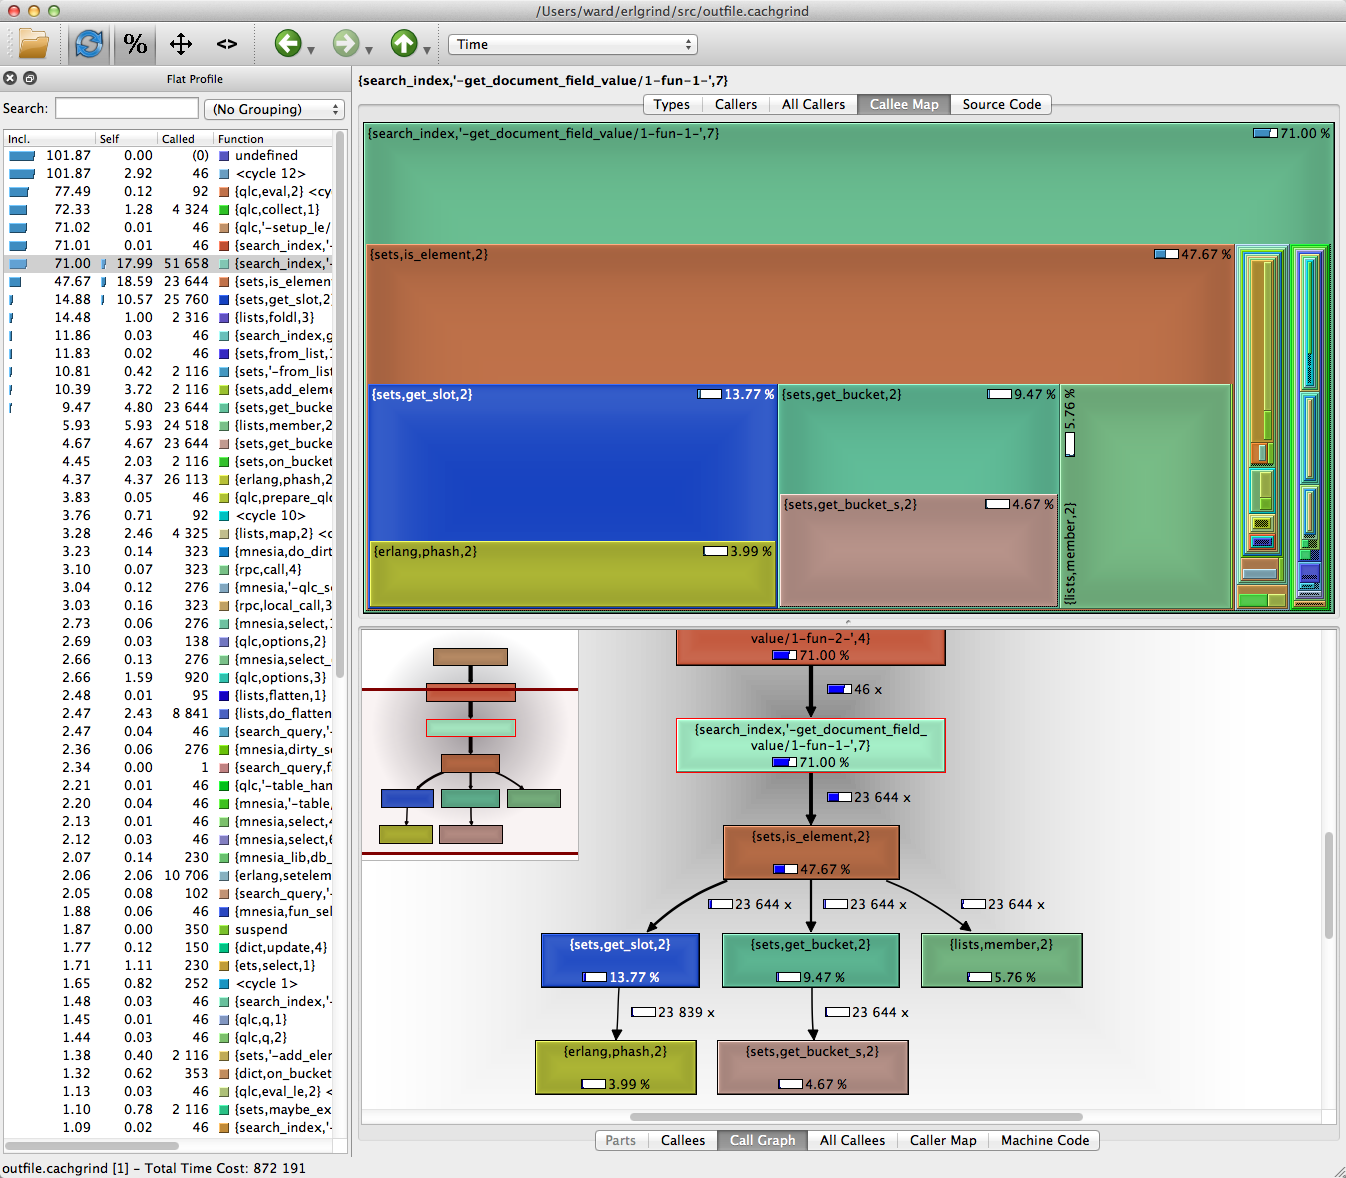
Erlang Fprof Output Confusing? Try KCachegrind.
Your Erlang code is perfect, but to find out why other peoples code runs dog slow you probably profile the code with fprof like this:
1 2 3 | |
The printout of fprof analyse is a text dump of the result, which can grow over 1000 lines and contains a lot of noise which makes it hard to locate the bottlenecks. Below a truncated sample of an actual fprof trace.
KCachegrind
KCachegrind to the rescue! With this tool you can visually inspect the fprof analyse result with sorting, a fancy call graph view, callee map and more.

As KCachegrind can’t read fprof analysis output directly, you need to convert it first to the callgrind format with the Erlgrind script by Isac Sacchi e Souza.
1
| |
KCachegrind & Erlgrind Installation
For installation of KCachegrind on my Mac I use Homebrew, a package manager for OSX. Notice that you install qcachegrind, the QT version of KCachegrind.
1 2 3 | |
Installing the Erlgrind (Github) script:
1 2 3 | |
And open qcachegrind:
1
| |
Enjoy!
